Projects
Click on the titles or images to access the project
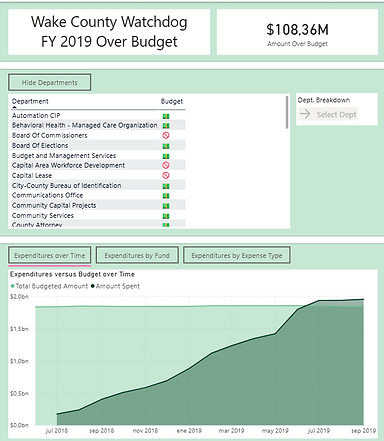
This interactive Power BI report analyzes the budget execution of Wake County, a simulated organization composed of multiple departments, cost centers, and funds. The main goal is to identify whether spending at both the global and departmental levels remains within the allocated budget, and to allow users to explore the reasons behind any variances in depth.
This project stands out for its application of the Progressive Disclosure approach, offering a user-centered experience with scalable detail levels.
This project consisted of building a data warehouse in SQL Server to integrate information from two different business systems: CRM and ERP. Initially, both systems delivered data in different formats and structures, which made analysis difficult and created inconsistencies.
To solve this, I designed a solution based on the Medallion Architecture (Bronze, Silver, Gold):
-
In the Bronze layer, raw data was ingested directly from the sources.
-
In the Silver layer, cleaning and transformation processes were applied to correct inconsistencies.
-
In the Gold layer, the data model was optimized, integrity controls were applied, and it was prepared for reporting and analysis.
The result was a consolidated and easy-to-use data model that allowed business teams to better analyze commercial performance and make more informed decisions.

Performance analysis of three sales strategies (email, call, and email + call) during a 6-week product launch.
To achieve this, data cleansing, exploratory analysis, data visualization, and definition of key metrics were carried out using SQL and Python.
I identified the most profitable strategy per interaction and recommended resource optimization .
I used metrics such as median revenue per interaction to support strategic decisions.

This project involves the development of an interactive Excel dashboard focused on the internal financial management of my company, Ecolocos SAS . The main objective was to automate budget tracking by areas and concepts , as well as the management of internal debts between members and the company . To achieve this, automated registration panels were designed using macros , data transformation with Power Query , dynamic visualizations with linked tables and graphs, and advanced conditional logic. This system allows data to be entered in a controlled manner, key metrics to be displayed , and detailed control of budget execution and outstanding balances between members to be obtained, all from an Excel environment without the need for external software.
This project focused on analyzing data from the human resources department of the fictional tech company Atlas Labs. This interactive report, developed in Microsoft Power BI , aims to monitor key workforce metrics and explore the factors that influence employees' decisions to leave the company . The analysis ranges from data entry and cleansing to demographics, performance, and job satisfaction levels.

This project aims to analyze a retail store's sales by applying data cleansing with SQL and exploratory analysis with Power BI.
Using a database of over 12,000 transactions, we applied cleansing and standardization techniques to ensure data quality. We then explored purchasing behavior patterns, performance by product category, payment methods, and more, identifying key opportunities to improve our business strategy .


