
Exploring Labor Data and Attrition Factors in Atlas Labs
Atlas Labs is a fictional technology company interested in using analytics to optimize human resources management. The HR department faces two key challenges:
Monitor the most relevant metrics related to the structure and performance of your staff.
Identify factors associated with employee attrition in order to anticipate risks and design more effective retention strategies.
This project emerges in response to these needs, structuring a comprehensive report that allows the organization's leaders to make informed decisions aligned with the well-being of the team.
TOOLS USED

Microsoft Power BI
Data validation
Data modeling
Exploratory analysis (EDA)
Data visualization
Interactive dashboard with KPIs
Data modeling
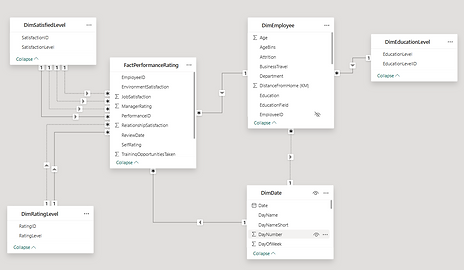
A "Snowflake" model was applied, where the "Fact_PerformanceRating" table centralizes the relationships. A calculated date table (DimDate) was included using DAX to facilitate temporal analysis . Multiple relationships between tables were managed by activating and deactivating relationships based on the required analysis using DAX functions.
Data loading and validation
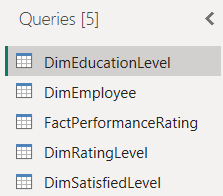
The database used has 5 tables: 1 fact table (fact) and 4 dimensional tables (Dim). The fact table, "FactPerformanceRating," displays the satisfaction and rating data given by each employee in different areas and has more than 6,000 records . The dimensional, or context, tables are "DimEducationalLevel," "DimEmployee," "DimRatingLevel," and "DimSatisfactionLevel." Each contains context data linked to the fact table by an ID.
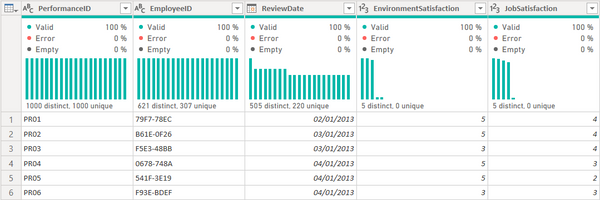
The process began with the import of .csv files . In Power Query , I manually validated data types to avoid errors. Mistyped columns (e.g., dates in malformed text) were identified and corrected using Split, Format, and date conversion. TRIM and CLEAN functions were applied to remove invisible characters and unnecessary spaces, ensuring the integrity of the analysis.
Exploratory analysis (EDA)
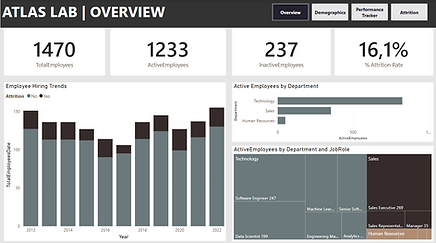
Basic metrics such as Total Employees, Active Employees, Inactive Employees, and Attrition Rate were created. Hiring trends by year were analyzed, as well as the distribution of employees by department and role.
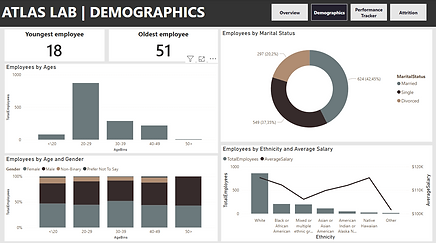
Demographic analysis
Demographic variables such as age, gender, marital status, and ethnicity were also reviewed, allowing the detection of relevant patterns within the company. These insights help the HR team identify opportunities for inclusion and team integration.
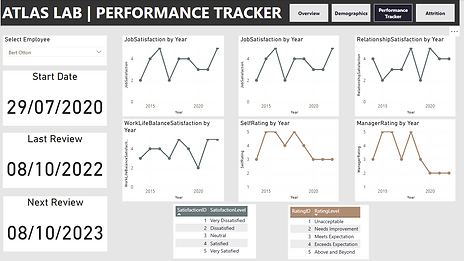
Performance and satisfaction analysis
The Atlas Labs Human Resources team was looking for a tool that would allow them to visualize the performance and satisfaction of each employee individually, in order to guide personalized actions based on their needs. Guideline metrics (contract start date, last and next review) and satisfaction levels were implemented in graphs, adjusting the relationships between tables for each analysis using DAX. Line visualizations and auxiliary tables were included to facilitate interpretation of the results.
Income distribution by method
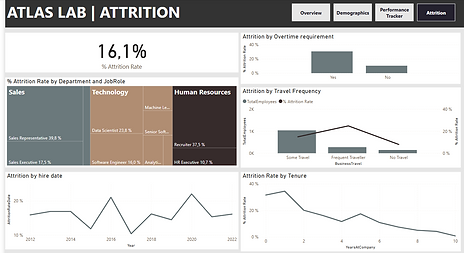
To identify and analyze patterns that lead to employee turnover, a report was created evaluating different variables against the turnover rate. Variables such as department and role, hire date, travel frequency, overtime, and seniority were studied.
Employees with frequent travel or overtime hours were found to have a higher attrition rate . Some roles, such as Sales Representatives, were also found to have particularly high attrition rates. These variables are key to developing retention strategies.


KEY PERFORMANCE INDICATORS (KPIs)
Since our goal is to identify the causes that affect the churn rate , I recommend using the following key performance metric (KPI):
Dropout rate (General and according to each variable evaluated)
Current results:
Overall dropout rate of 16.1%
Different abandonment rate values according to department, overtime, travel frequency, etc.
This KPI allows you to track overall results for the company and for each variable reviewed, to determine whether the strategies implemented are having an effect.

RECOMMENDATIONS
Monitor the attrition rate indicator monthly , both across the company and in each area with identified high values (for example, by department, by employees who work overtime, frequent travelers, etc.).
Conduct team satisfaction surveys more frequently (Currently, it is annual; the survey could be shortened to semiannual or quarterly ).
Evaluate each individual case based on the results of each employee's survey, and address each case with negative results individually.
Review travel and workload policies in critical areas.