
Power BI Project – Budget Analysis of Wake County
This interactive Power BI report analyzes the budget execution of Wake County, a simulated organization composed of multiple departments, cost centers, and funds. The main goal is to identify whether spending at both the global and departmental levels remains within the allocated budget, and to allow users to explore the reasons behind any variances in depth.
This project stands out for its application of the Progressive Disclosure approach, offering a user-centered experience with scalable detail levels.
Key Tools and Concepts Used
✅ Progressive Disclosure
Used to guide users from a high-level overview to detailed analysis only when needed, avoiding cognitive overload:
-
Bookmarks to dynamically show or hide sections of the report.
-
Custom Tooltips to reveal financial details on hover.
-
Drill-through functionality to navigate to detailed department-level analysis.
-
Dynamic buttons to switch between visuals in the same space.
✅ Data Modeling and DAX
-
Calculation of key metrics: actual vs. budgeted amounts, absolute and percentage variance.
-
Rolling totals by month, quarter, and year.
-
Context-sensitive filtering using relationships and conditional measures.
✅ UX-Focused Design
-
Clean navigation and layout.
-
Elements appear only when relevant.
-
Button toggles and slicers for a customized view.
-
Q&A visual for ad-hoc exploration using natural language queries.
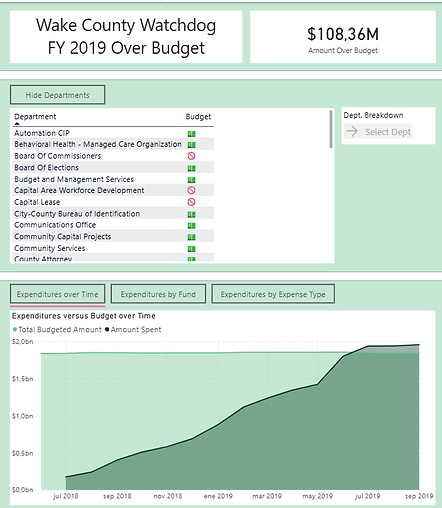
1. Main Page: Over Budget
Goal: Provide a global view of budget status and access to detailed exploration.
Key elements:
-
Main card showing total budget overage.
-
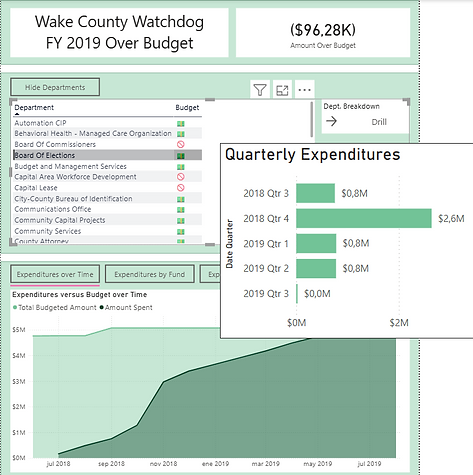
Department table with icons and quarterly tooltip summaries.
-
"Drill" button for department-specific analysis.
-
Interactive visual section (toggleable by button):
-
Budget vs. actual over time.
-
Spending by fund.
-
Spending by expense type.
-
-
A "Show/Hide Departments" button to collapse or expand the department section.
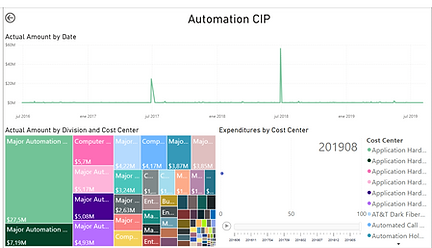
2. Department Breakdown
Goal: Show a detailed breakdown of the selected department's budget performance.
Key elements:
-
Line chart of budget usage over time.
-
Breakdown of expenses by sub-units and cost centers.
-
Automatically triggered via drill-through from the main page.
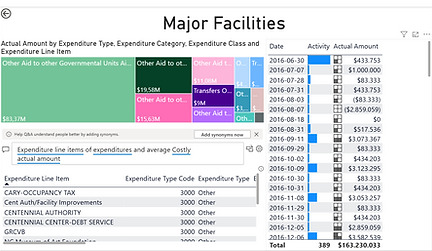
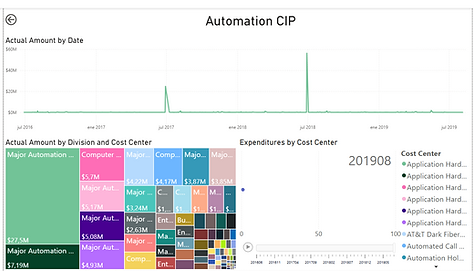
3. Expenditure Lines
Goal: Explore funds and transaction volume in greater detail.
Key elements:
-
Transaction volume and amount over time.
-
Categorized by expenditure type and code.
-
Q&A visual enabling queries like:
"Which fund spent the most in Q3 2017?"
"Average actual amount by cost center"


Real-World Value of the Report
This type of dashboard is essential in public or private financial management contexts, as it enables:
-
Quick identification of budget overruns.
-
Tracking of which departments or funds are overspending.
-
Evaluation of efficiency across organizational units or expense types.
-
Data-driven decision making regarding budget adjustments or investments.
-
Transparent, accessible analysis for decision-makers and non-technical users alike.
By incorporating interactive navigation, guided drill-down, and natural language Q&A, the report empowers users to explore and understand financial data on their own terms.
Skills Demonstrated
-
Advanced Power BI: bookmarks, buttons, drill-through, tooltips, Q&A visual.
-
DAX Modeling: dynamic measures, time intelligence, context-sensitive calculations.
-
User-centered dashboard design: guided navigation, clear data storytelling.
-
Analytical thinking: budget control, fund tracking, time-based performance analysis.