Development of a Financial Management System for Ecolocos SAS: Budget and Internal Debts
This project was born out of the need to implement comprehensive financial control in my company, Ecolocos SAS —a young, small, and sustainable organization— which recently received an award from the UNDP in the "Sustainable Production and Consumption" category. To access this recognition, we must meet specific, pre-established objectives and criteria distributed across different areas.
The tool developed enables detailed monitoring of the assigned budget, broken down by area and concept, and accurately manages internal debts and payments between team members and the company. A fully Excel-based solution was created that automates data capture, performs automatic calculations, and provides clear visualizations of key financial indicators, ensuring transparent and efficient resource management.
Tools Used

Microsoft Excel
Creating databases
Macros and automations
Data visualization
Power Query (Data Transformation and Processing)
Pivot tables and data slicers
General Dashboard Structure
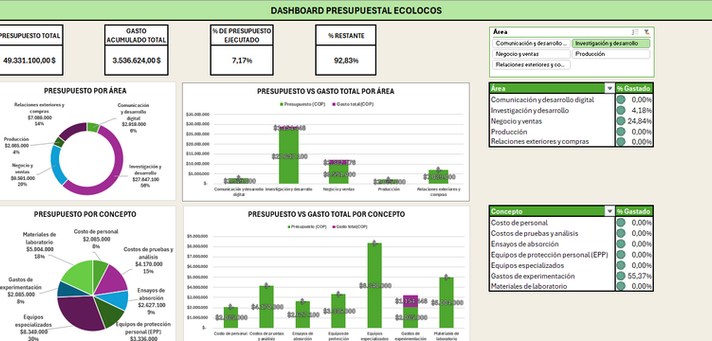
The General Dashboard allows you to view the company's budget status by area and concept , facilitating the monitoring of the allocated budget, the expenses executed and the remaining balance.
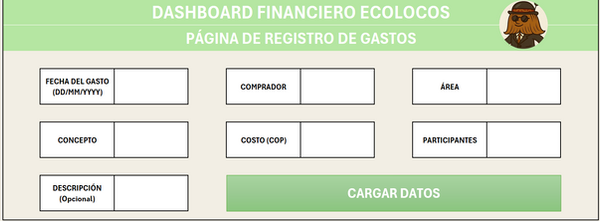
This dashboard is automatically populated with data entered by the user through a registration form and is updated in real time through the combined use of Power Query and pivot tables . All information is processed in a structured manner to facilitate decision-making and financial control.
Main visualizations:
Budget by Area : Donut chart, shows the budget balance for each area in percentage and value.
Budget vs Total Expense by Area : Stacked column chart, compares total budget vs. actual expenditure.
Budget by Concept : Pie chart, filtered by area, reflects the distribution of the budget between concepts in the selected area.
Budget vs Total Expenditure by Concept: Stacked column chart, shows individual budget execution by concept for the selected area.
Highlighted Features:
Interactive panels with slicers to filter by area.
Traffic light table: Shows green for budget expenditure <75%, yellow for >= 75% and red for more than 90%
Automatic update from the registration panel.
Key KPIs such as total budget, total expenditure, and overall remaining balance.
This dashboard allows for a clear and detailed visual analysis of internal resource usage, improving decision-making and financial control.
Debt and payment management module
This section was developed to solve a common problem within the group: a lack of organization in managing shared accounts . Until then, expenses incurred by different members were not recorded in a structured manner, leading to confusion, missed payments, and uncontrolled accumulated debts. The module now allows for clear and automated tracking of who owes whom, how much they have paid, and how much remains to be paid.
What does this module do?
Automatically records debt relationships between members based on expenses entered in the expense log panel.
Calculate the amount per person according to the group's internal rules (for example, if Ecolocos participates, they assume 100% of the expense).
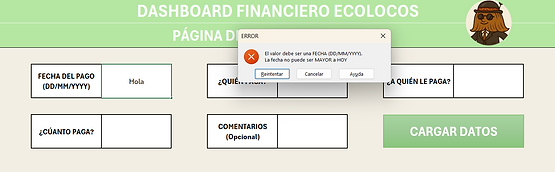
Keep track of partial or total payments , reflecting outstanding balances in real time, through the payment record made in the payment registration panel .
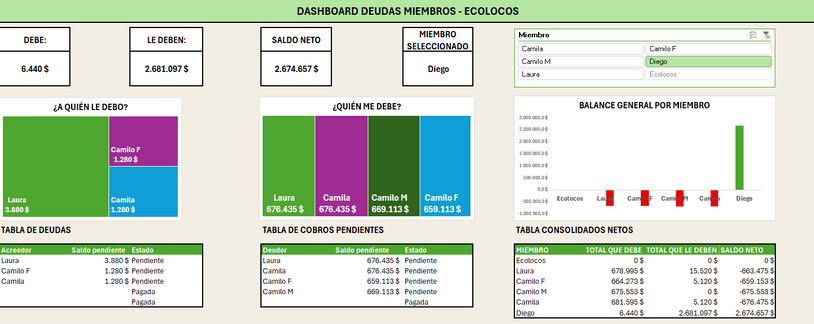
It allows you to view the net balance of each person (what they owe vs. what they are owed).
Key elements of the module:
Display and tables of debts and payments
A section shows who the selected member owes.
Another section shows who owes him/her
Individual financial KPIs
Four dynamic indicators:How much does a member owe?
How much do they owe you?
Your net balance
Custom summary tables
Table showing the balance sheet of each member.
Complementary graphics
Net consolidated per person
Visualization of "who owes me" and "who I owe"
The entire module is connected through slicers, allowing you to view all information filtered by member clearly and without manual intervention.
Automation and security
One of the main objectives of the project was to ensure that data was managed in a structured way and free from the risk of manual manipulation. To achieve this, mechanisms were implemented to automate the flow of information from data entry to visualizations, while protecting the integrity of the databases.
Implemented measures:
-
Automated data entry panels
-
Data is entered through controlled forms, preventing users from directly editing the tables. This ensures consistency and minimizes errors.
-
-
Controlled writing macros
-
Macros were developed to securely record information into the databases, without exposing sensitive cells or allowing accidental changes.
-
-
Sheet protection
-
Sheets containing databases and key formulas are hidden and/or locked to prevent modifications, allowing only data entry or viewing through dedicated panels.
-
-
Secure interaction with dashboards
-
Visualization sheets allow interaction through filters and slicers, but are locked to prevent editing of formulas, charts, or pivot tables.
-
-
Automatic updates with Power Query
-
Data transformations and complex relationships (e.g., between expenses and debts) are automatically updated when new records are entered, eliminating the need for manual processes.
-
Thanks to this structure, the system is robust, reliable, and easy to maintain, even in collaborative environments.


KEY INSIGHTS AND BENEFITS
Centralization of information
All budget and debt control is managed from a single file, accessible and understandable by any team member.
Reducing human error
By eliminating the need to manually edit tables, errors in records, calculations, and visualizations are reduced .
Traceability and transparency
Every expense, debt, and payment is clearly recorded, facilitating tracking and avoiding misunderstandings between members.
Ease of decision-making
Visualizations allow you to quickly identify which areas are spending the most money, which members have outstanding balances, and how resources are distributed.
System scalability
The structure is designed to grow. It can easily adapt to more areas, concepts, or members without having to redesign from scratch.
Practical learning
Through this project, key tools such as Power Query, macros, pivot tables, logical functions, and data visualization in Excel were applied, developing technical skills that can be directly applied in real-life professional contexts.