

Sales analysis of a retail store
A retail store seeks to better understand its sales behavior in order to identify purchasing patterns , growth trends , and opportunities for improvement . To do so, it uses a database with transaction history over several months, including information on categories, products, customers, dates, total amounts, and more.
This project simulates a real-life scenario in which a data analyst must prepare information, clean up common errors, and extract relevant insights that support business decisions, such as inventory optimization, marketing campaigns, or product expansion.
TOOLS USED

SQL (PostgreSQL)
Data loading
Duplicate handling
Data standardization
Treatments of NULL values

Microsoft Power BI
Exploratory analysis (EDA)
Data visualization
Interactive dashboard with KPIs
Initial problems

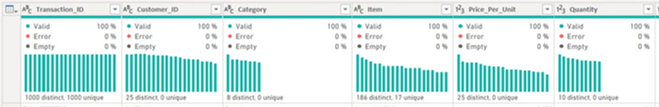
The database was obtained from the Kaggle platform and had 12,575 rows and 8 columns. It presented the following problems :
Potential duplicates
Inconsistent text fields
5 columns with null values
Unstandardized and unvalidated data
Data Cleansing (SQL)
To solve the above problems, I performed the following tasks:
I removed duplicates and unnecessary spaces (TRIM)
I standardized column names, data types, and values
I imputed null values (NULLs) with logical rules
I imputed missing values using logical relationships between the columns "item", "price_per_unit", " quantity" and "total_spent".
I imputed missing values in the "Discount_Applied" column using the mode of the column.
I deleted unrecoverable records (<5% of the total)
I deleted records in those rows where there were no logical relationships between columns.
I exported the cleaned version for analysis in Power BI and performed data validation in Power Query.

EXPLORATORY ANALYSIS (EDA)
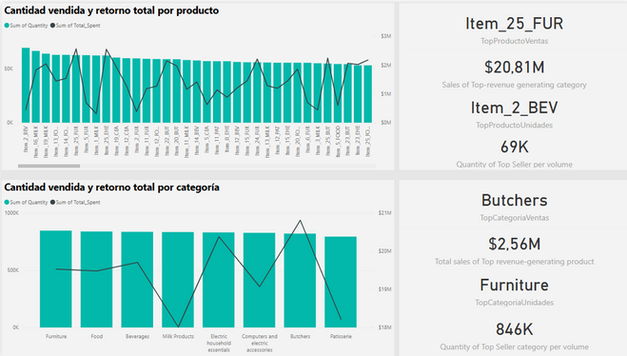
Product and category analysis
This analysis focused on understanding which products and categories represent the highest sales volume and economic return for the store . Using comparative graphs, both the number of units sold and the monetary value generated were evaluated.
Highlighted Insights:
Highest Returning Product : Item_25_FUR , with $2.56 million generated.
Category with the highest return: Butchers , with $20.81 million.
Best selling product (in units) : Item_2_BEV.
Category with the most units sold: Furniture.
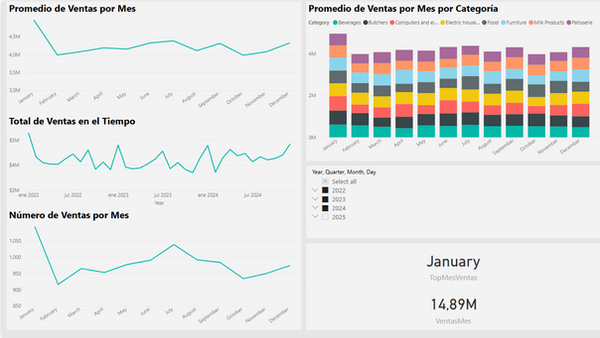
Temporal and Category Analysis
In this section , sales were analyzed over time (from January 2022 to December 2024). to identify monthly trends and seasonality. The participation of each category was also broken down by month, observing whether any category dominated during certain periods.
Highlighted Insights:
January is the month with the highest sales volume in all the years analyzed.
Monthly sales are relatively stable , with no major fluctuations beyond January.
The distribution of sales between categories is very uniform , without a predominant one.
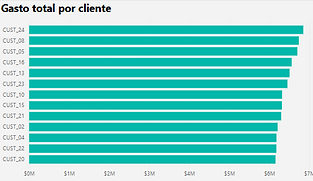
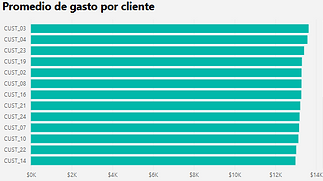
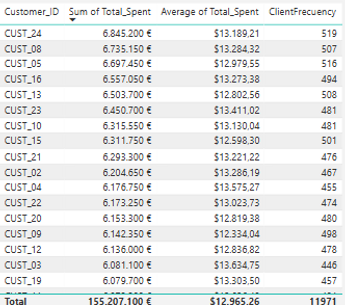
Customer Analysis
Here, individual customer behavior was evaluated, focusing on three key metrics: purchase frequency, total cumulative spend, and average transaction rate . This allows for the identification of high-value profiles and purchasing patterns.
Highlighted Insights:
👤 Most frequent customer and total spend : CUST_24.
💳 Highest average spend per purchase: CUST_03.
🔍 There is no clear relationship between frequency, total spending, and average spending ; customer behavior is fairly homogeneous.

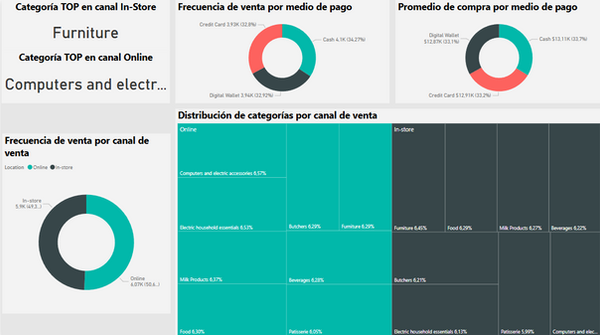
Analysis of Payment Channels and Methods
Customer preferences regarding purchasing methods (channels) and payment methods were analyzed. In addition, the average ticket price for each option and the distribution by category within each sales channel were evaluated.
Highlighted Insights:
Very balanced sales channels : Online (50.6%) vs In-Store (49.4%).
Most common payment method: Cash (34.27%), also with the highest average ticket ($13.11K).
Top category by channel:
In-Store: Furniture
Online: Computers and Electric Accessories
- All categories and media present very even distributions (none clearly dominates).
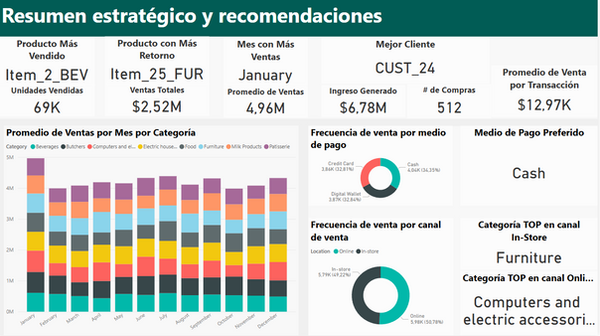
Analysis of Payment Channels and Methods
This final page compiles and displays the key KPIs obtained during the analysis . The goal is to provide an executive summary with actionable metrics to support business decision-making .
KPIs and key findings:
Best-selling product and product with the highest return.
Month with the most sales: January.
Most valuable customer: CUST_24, with the highest total spend and frequency.
Average ticket per transaction: $12.97K
Most used payment method and top category by channel.
Final recommendations
Based on the analysis, I recommend the store to do the following:
Frequently monitor the determined KPIs .
Since January is the strongest month for sales, it is recommended to concentrate advertising campaigns and inventory in December and January.
Conduct a customer study to identify the reasons for the drop in sales from January to February.
Generate promotions and campaigns that encourage increased sales in the month of February.
The Computers and Electrical Accessories category could be strengthened in the online channel with exclusive bundles or special offers.
Explore strategies to build customer loyalty more frequently, such as personalized discounts.
Improve data collection in the "discount applied" section to analyze the discount's effectiveness on customer purchasing behavior, since in this case, with so many null values, it was not possible to analyze it.